In 2006, when British mathematician and Tesco marketing mind mastermind Clive Humby shouted from the rooftops “ Data is the new oil”, 15 years down the line, it has become the most invaluable asset for the world.
With the increasing adoption of innovative technologies, data have never been more crucial for businesses to remain competitive. The key to success lies in developing a strategy that leverages data and leads to improved customer service and increased revenue.
According to a Deloitte poll, 49% of respondents believe insights analytics improves them make better decisions, 16% believe it helps them better facilitate critical strategic projects, and 10% believe it guides them to enhance connections with consumers and business partners. However, in order to immensely benefit, you must understand how to extract the most value from your data. This is where actionable insights monitoring makes the data relevant.
Forrester reports Only 29% of companies are effective in connecting analytics to action, despite the fact that 74% claim to desire to be “data-driven.” For firms that seek to achieve business outcomes from their data, actionable insights appear to be the missing link.
And, to solve this hassle, Toolyt brings you a new “Insights” feature.
What is the new ‘Insights’ application feature?
Data Visualization to make your work easy!
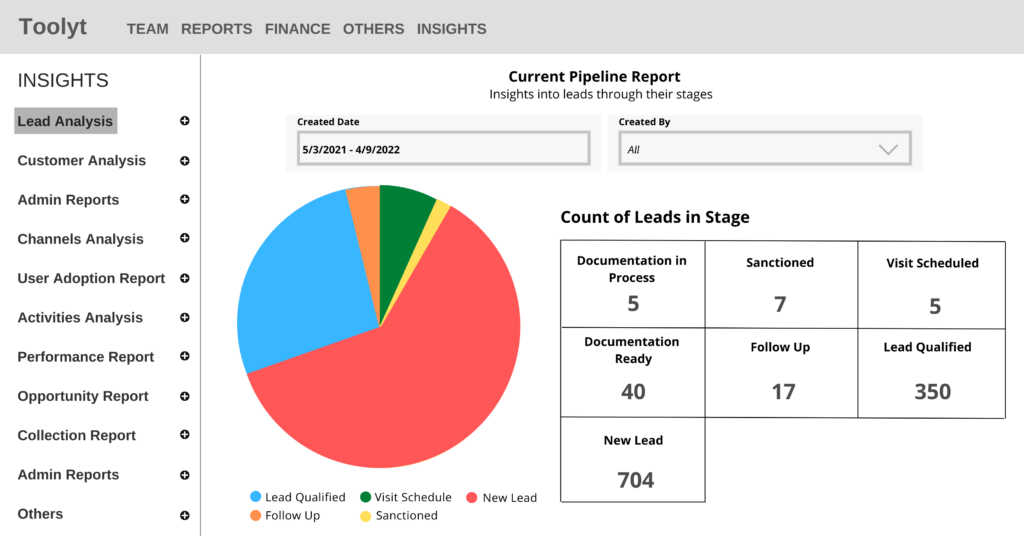
To help all our customers and partners with the data visualization, we present a feature to directly interact with the analytics information, where you can. Data can be represented by a variety of charts, such as line charts, bar charts, or pie charts, from which users can gain more penetrating insight than by numerical analysis alone. The ability to pull the metrics and visualize KPIs by building custom dashboards makes ‘Insights’ a powerful feature for all our users. Information is routinely presented via data visualizations, reports, and dashboards.

Insights are produced through analyzing facts and drawing conclusions. Both data and information pave the path for the discovery of unique insights that can then be utilised to influence decisions and implement change.
Based on accurate insights monitoring, you’ll be able to balance your team resources and drive actions in your organization to optimize your opportunities and increase the market share.
Some of the vital dashboards of the new Insights application feature are –
Lead Analysis – Sales managers can keep an eye on the volume of incoming leads and how quickly their team are able to qualify them.
Performance Report – Gauge performance and enable the Sales Team to measure, monitor, and manage the key activities and processes needed to achieve business goals.
Opportunity Report – Sales executives and sales team members can analyze what type of deals the company is generating, where and at what cost.
Collection Report – Improve revenue strategies and related outcomes to reduce the chances of low-performing areas.
Whether it’s identifying the time taken to move between stages in “ Lead TAT ( Turn Around Time) Analysis or generating a “Customer Distribution” report, Insights will give all the in-depth data visualizations in real-time.
Why is it Important?
Data visualisation, in particular, uses visual data to express information in a universal, swift, and effective manner. This method may assist businesses in determining which areas require improvement, which variables influence consumer happiness and discontent, and what to do with certain items (where should they go and who should they be sold to). Stakeholders, company owners, and decision-makers may better estimate sales volumes and subsequent growth using visualised data.

This feature will enhance and improve in the identification of last month’s results to this month’s results. And, whether customers are having similar problems, and assess whether improvements should be done using the data from these measures. Observing these metrics can assist the sales reps in locating a common issue or misunderstanding with the company’s product or service. This will help relay the problem to operations or development teams who can resolve it. Customers will be more satisfied with the firm as an organization of this. Also, Sales managers can track metrics and KPIs to enhance the overall performance of the sales reps.
Conclusion
By enabling the application insights feature, any organization can make a breakthrough with data visualisations and analytics. Not only, this will enhance the business growth but also save time and development for the companies.
So what are you are waiting for?
Book your demo now & see the results!


