
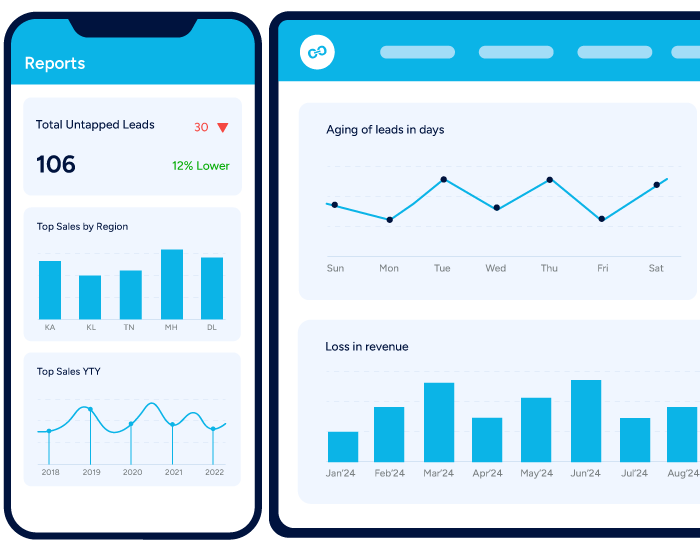
TAT management
Monitor the time each rep spends at every stage, capture accurate sales intel and reduce turnaround time where it actually accumulates.
- Stage-level SLA tracking
- Rep vs team benchmark
- Breach escalation
See conversion and ageing at each stage, find the exact step where deals stall, and fix the process instead of guessing at the outcome.
Funnel by stage - this quarter
12,480 opportunities
avg conversion
4.8 day dwell
> 7 days idle
-4 vs last Q
Conversion by stage
Stalled right now
Credit stage
412 files idle over 5 days
Document stage
268 files awaiting upload
Site visit
97 visits unscheduled
A single conversion percentage hides the problem. Stage-level detail names it.
Which stage drops the most deals, and is it people or process?
How long does a file sit at each stage before it moves?
Which reps clear a stage faster than their peers, and why?
Are high-value deals ageing in the same place as small ones?
Did last month's process change actually shorten the cycle?
Stage definitions follow your own workflow, whatever it is called internally.
Configurable to your workflowStage conversion
Share of opportunities that move from one stage to the next.
Target coaching at the leak
Dwell time
Average and median time a deal spends inside a stage.
Set stage-level SLAs
Ageing buckets
Count of deals idle for 0-2, 3-7, 8-14 and 15+ days.
Escalate before a deal goes cold
Drop reasons
Structured reasons captured when a deal exits at a stage.
Fix the top recurring cause
Rep comparison
Same-stage performance across reps, teams and branches.
Replicate what the top quartile does
Value at stage
Pipeline value held in each stage, not just deal count.
Prioritise the stage holding the money
Capture stage-wise analytics in real time, then act on the one step that is costing you conversions.
Monitor the time each rep spends at every stage, capture accurate sales intel and reduce turnaround time where it actually accumulates.
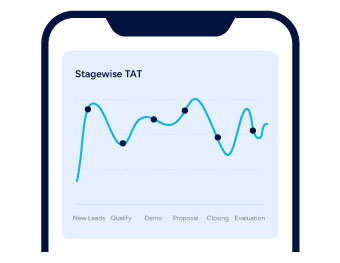
Analyse stage-wise performance to see where the team is lacking, then redesign the workflow to maximise productivity and keep visibility intact.
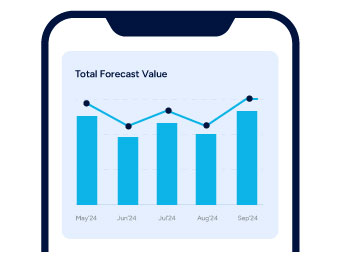
Track every deal progression in the pipeline and prioritise high-value opportunities with actionable, stage-level insight.
Stage data becomes useful the moment it interrupts someone.
A deal exceeds the allowed dwell time for its stage.
A file moves backwards, signalling rework or missing data.
A stage's pass rate falls below its trailing average.
Field rep
Their own stalled deals ranked by value and days idle.
Branch manager
Stage bottlenecks by team, with named files to unblock.
Sales ops
Cycle-length trend and evidence for process change.
The report is built for the daily huddle, not the quarterly review.
Emailed list of files breaching stage SLAs, by owner.
Tap a stage to see the exact deals sitting inside it.
Compare this month's funnel against any prior period.
Push stage-level data to your warehouse or BI tool.
Analytics & Business Intelligence
Dashboards, drilldowns and scheduled reporting on web and mobile.
ViewLive Sales Metrics
Target versus achievement in real time, on the rep's phone.
ViewUntapped Leads Report
Every lead nobody has touched, with the owner named.
ViewLeads Activity Report
The full engagement trail behind each lead and customer.
ViewTAT Analysis Report
Turnaround time from creation to closure, stage by stage.
ViewA stage-wise performance report breaks the sales funnel into its individual stages and measures conversion, dwell time, ageing and pipeline value at each one. In Toolyt it uses your own workflow stages, flags deals that breach stage SLAs, compares reps at the same step and shows whether a process change actually shortened the sales cycle.
Quick answers about how Toolyt works for field sales, lending and service teams.
Talk to our teamSales professionals from startups to Fortune 500 companies in over 20 countries improve their productivity with Toolyt every day.