Toolyt

Analytics & BI

Analytics and business intelligence on mobile and web

One reporting layer over your entire sales, onboarding and collections data - built so a regional manager can answer a question on a phone in the field, not a week later in a spreadsheet.

Executive dashboard

Live - refreshed every 60 seconds

Live
Pipeline value
Rs 428 Cr

+12.4%

Conversion
31.6%

+3.1 pts

Avg TAT
2.4 days

-38%

Active reps
1,284

94% logged in

Disbursals by region - this month

  • WestRs 148 Cr
  • SouthRs 126 Cr
  • NorthRs 98 Cr
  • EastRs 56 Cr

Scheduled reports

  • Branch scorecard

    Emailed daily, 8:00 AM

  • Untapped leads

    Pushed to RMs, hourly

  • TV dashboard

    Live on floor screens

Questions answered

The questions this answers before the meeting starts

Every widget is drillable to the individual record, so an answer never ends at a number - it ends at the lead, the rep and the next action.

  • Q1

    Which region is carrying the month and which one is quietly slipping?

  • Q2

    Where is pipeline value stuck, and for how long?

  • Q3

    Which products convert best for which sourcing channel?

  • Q4

    Which branches are below plan with the month half gone?

  • Q5

    What changed since yesterday that nobody has flagged?

Inside the report

What sits inside the platform

A short data dictionary of the objects your dashboards are built on.

Configurable to your workflow
  • Widget library

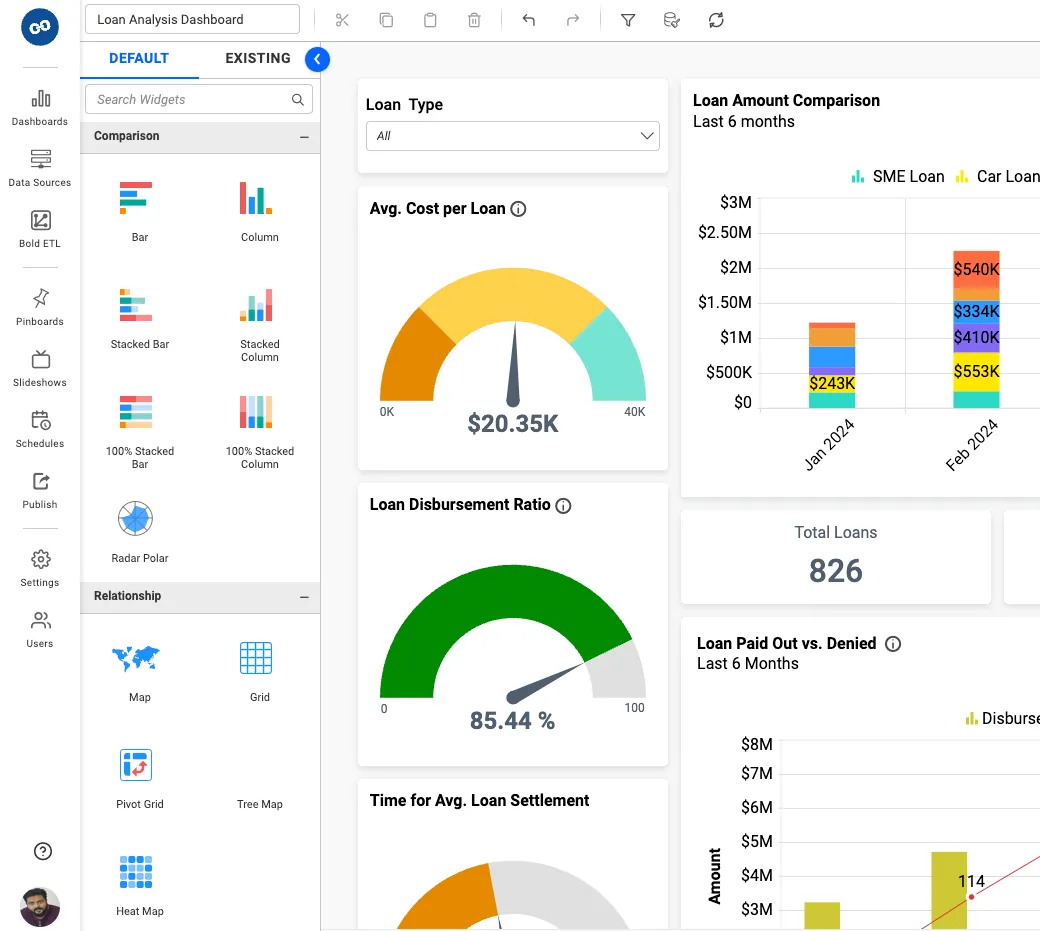
    Charts, funnels, doughnuts, heatmaps, cohort grids and tables that combine on one canvas.

    Assemble a board without writing SQL

  • User-wise privilege access

    Row and column level visibility mapped to role, branch, geography and hierarchy.

    A rep sees their book, a CXO sees the country

  • Scheduled reporting

    Any board can be emailed as PDF or CSV on a recurring schedule to named recipients.

    Reviews start with the numbers already read

  • TV dashboards

    Full-screen rotating boards for branch floors and operations centres.

    Performance stays visible all day

  • Predictive layer

    Results from external ML models and built-in forecasting rendered alongside actuals.

    Plan against a projection, not a hunch

  • AI insights (beta)

    Natural language questions translated into charts and summaries over your own data.

    Ask in plain English, get a chart

Capabilities

Built for people who act on data, not just read it

Interactive visualisation, forecasting and natural language - all inside the same platform your team already works in.

analytics and business intelligence
01

Interactive data visualisation

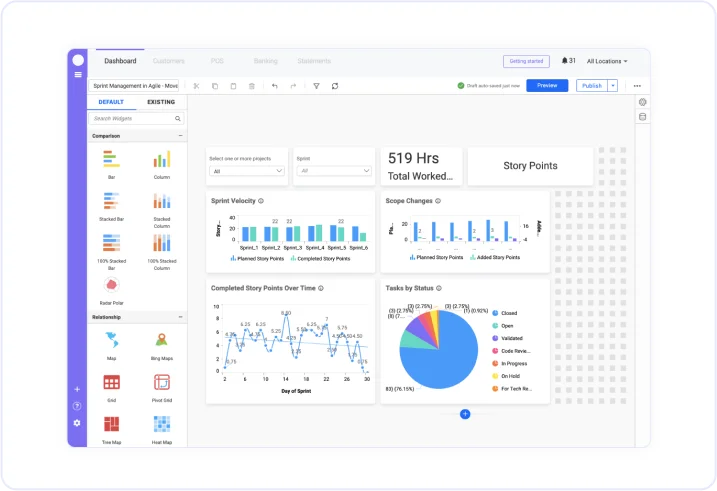
Combine widgets intuitively, filter across the whole board with one click and drill from a country-level number to a single lead record without leaving the page.

  • Cross-widget filtering
  • Drill to record level
  • Save and share views
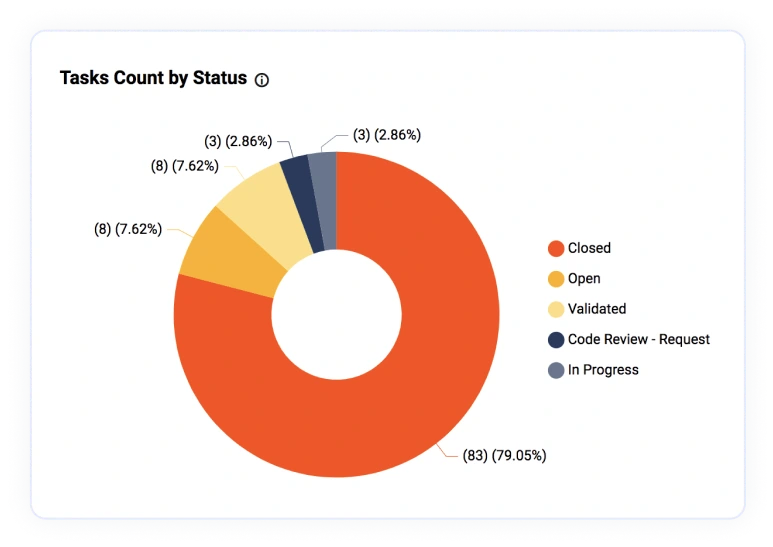
analytics and business intelligence doughnut
02

Advanced predictive analytics

Surface results from your own machine learning models next to live performance, or use built-in forecasting to project pipeline, disbursal and collection outcomes.

  • External model outputs
  • Built-in forecasting
  • Budget versus projection
analytics and business intelligence toolyt bi
03

AI for instant insights (beta)

Natural language processing turns a typed question into the chart that answers it, so managers stop queuing behind a reporting analyst.

  • Ask in plain language
  • Auto-generated charts
  • Narrative summaries

Alerts

Signals the platform pushes to you

Dashboards are the pull. These are the push - alerts that reach the right manager without anyone opening a report.

  • Plan breach

    Branch or region tracking below target pace mid-cycle.

  • Anomaly

    A metric moving outside its normal band day over day.

  • Silence

    A team with no logged activity against an open pipeline.

  • Field rep

    Their own targets, funnel and day plan on mobile - nothing else.

  • Branch manager

    Team scorecard, ageing pipeline and the reps who need a nudge today.

  • CXO

    Region, product and channel performance with drill-through to the record.

Delivery

Delivery, access and governance

Reporting is only useful if it reaches people safely and on time.

Mobile and web parity

Every board renders on the app, including offline snapshots of the last sync.

Scheduled email

PDF and CSV delivery on any cadence, with recipient-level data filtering.

Role-based access

Hierarchy-aware visibility so data never crosses a branch or region boundary.

API and exports

Push curated datasets into your data lake, BI stack or regulatory reporting.

In short

What is Toolyt Analytics and Business Intelligence?

Toolyt Analytics and BI is an embedded reporting layer over your sales, onboarding and collections data. Teams build dashboards without code, drill from a headline number to a single lead, schedule reports to email or TV screens, and use forecasting plus natural language AI to get answers on mobile and web with role-based access controls.

FAQ

Frequently asked questions

Quick answers about how Toolyt works for field sales, lending and service teams.

Talk to our team
What is Advanced Analytics and Business Intelligence?
Empower users with Analytics and Business Intelligence to make informed decisions and take immediate action, using up-to-the-minute data within the same platform.
How does Toolyt support interactive Data Visualization with Toolyt BI?
Toolyt Analytics and Business Intelligence platform enables intuitive combination of widgets for seamless data visualization. Users can explore and interact with analytics in multiple ways.
How does Toolyt support advanced Predictive Analytics?
Toolyt Analytics and Business Intelligence platform enhances your predictive analytics by displaying results from external machine learning models. Utilize our built-in forecasting methods to help stakeholders identify business risks and understand trends, making informed decisions easier.
How does Toolyt support artificial Intelligence (Beta) for Instant Insights?
Leverage AI and natural language processing (NLP) in Toolyt Analytics and Business Intelligence to instantly translate data into actionable insights, enabling effortless data visualization.

Take action today

Start offering your field sales team a better selling experience

Sales professionals from startups to Fortune 500 companies in over 20 countries improve their productivity with Toolyt every day.